What's the problem?
Transferring data from Excel to Prism can be awful in certain situations. Like when you need to transpose a bunch of vertical columns from Excel into both rows and columns in a Prism grouped sheet for 2-way ANOVA. It’s super tedious and it’s easy to make a mistake and copy something into the wrong place.
The fix: Extract and Rearrange
Setup
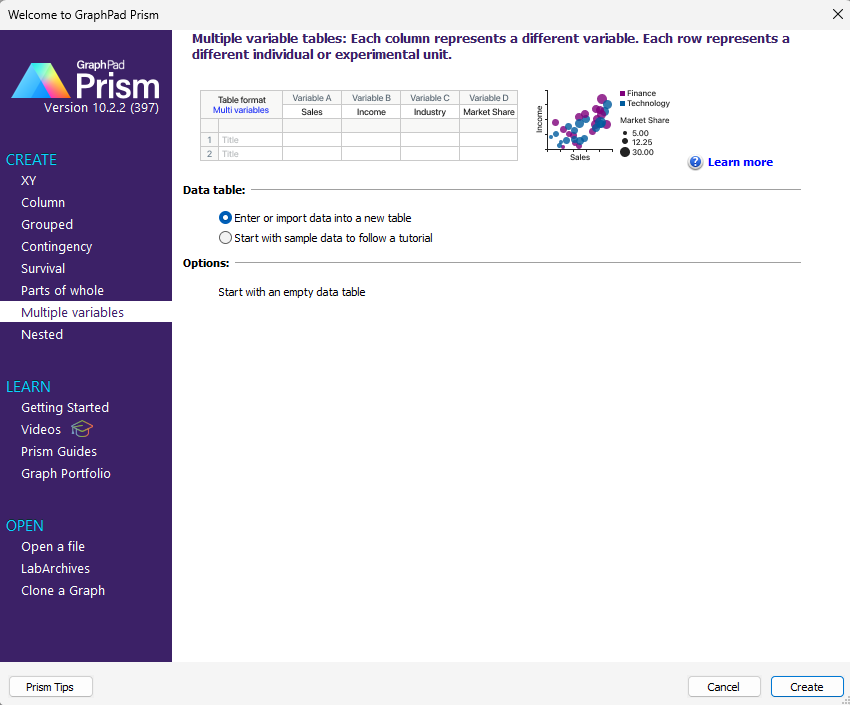
Create a multiple variables sheet in Prism
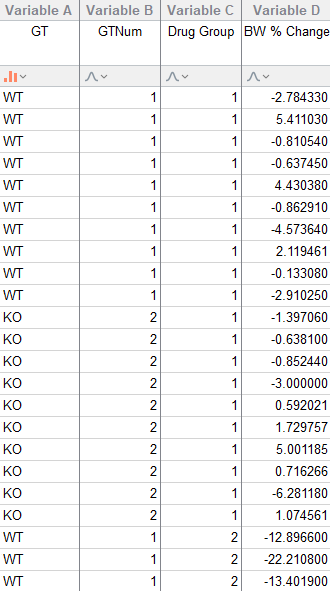
Place Excel 2-Way ANOVA data inside
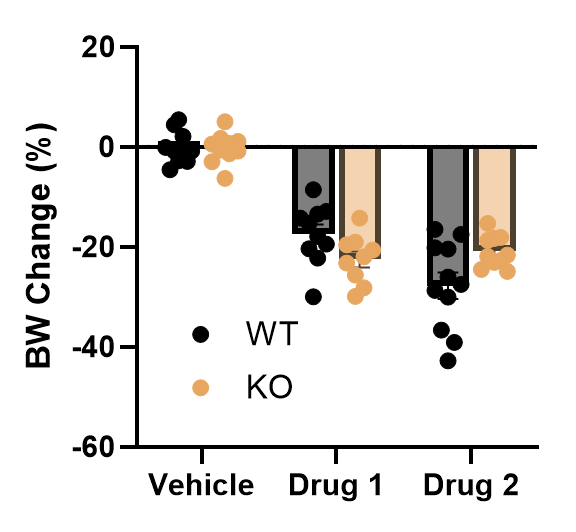
Everything goes in columns with one mouse per row. Prism automatically places your categorical variables in alphabetical order. That is fine but it makes the copying a little worse so I enter my values as numbers (WT = 1, KO = 2) and drug groups as sequential numbers. This makes it an easy copy+paste job to put the values into a new sheet.
Extract and Rearrange
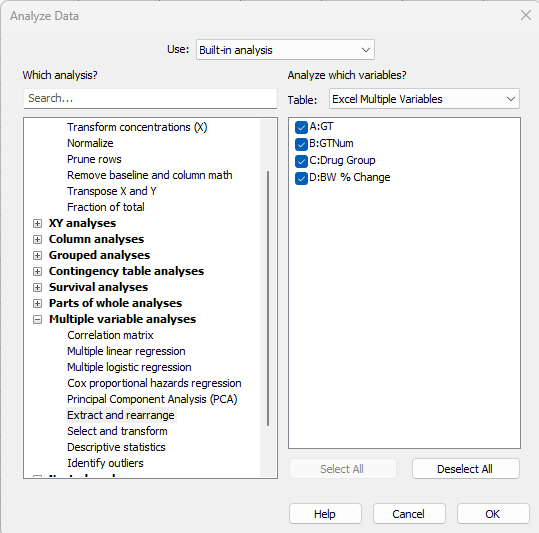
Analyze Pane
Click Analyze at the top under Analysis. Under Multiple variable analysis, choose Extract and rearrange.
Choose format
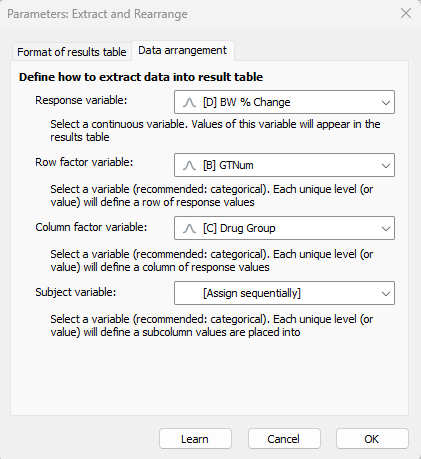
Select “Grouped for two-way ANOVA” then choose the data arrangement tab.
- Response variable: your Y values, in this case
BW % Change. - Row Factor: Drug group. This is numerical but it doesn’t have to be if you don’t mind extra copy+paste steps.
- Column Factor: I’m setting this to genotype (GTNum in this case so WT and KO come out in the right order). If you just use WT and KO, you’ll have to manually switch the rows after copy+paste to a new sheet.
Row or Column doesn't matter
You can set whichever groups you want to row or column. It just gives you a different shape of sheet but the analysis is the same.
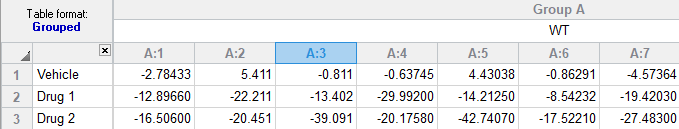
Extracted values
Now you have your values. You’ll find the extracted values down under the results tab on the left.
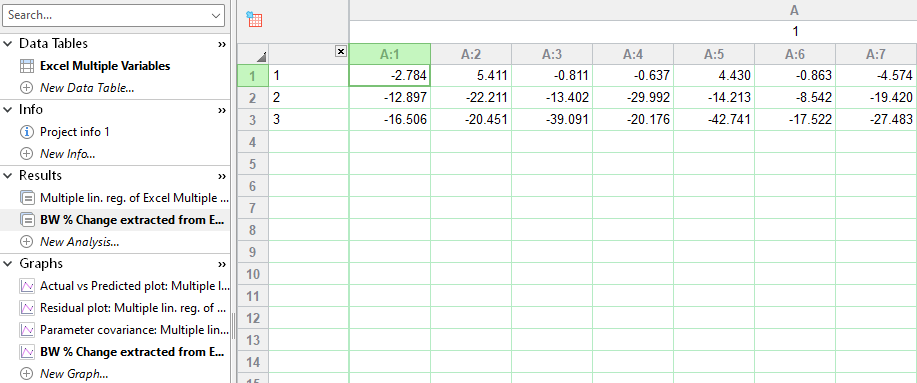
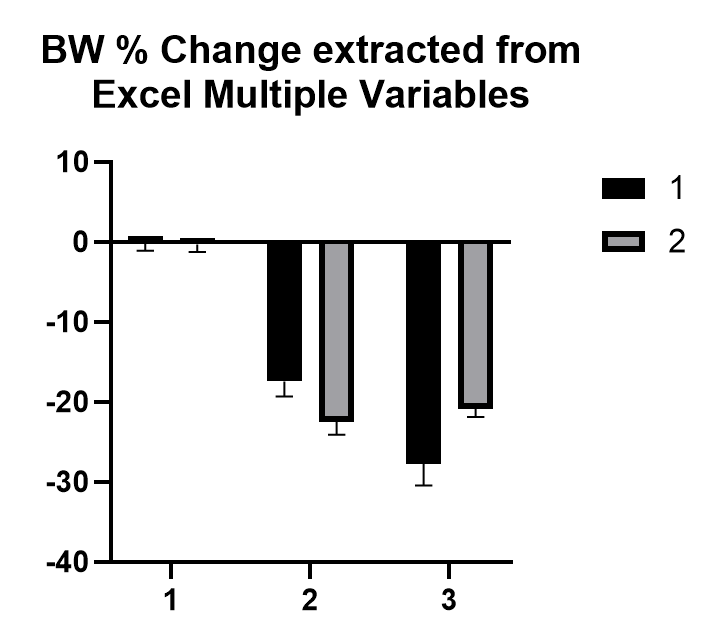
The results are even automatically graphed for you.
Copy to new sheet
You can leave the results as-is if you want to but you can’t edit the row titles to show your group names. For some reason you are allowed to change column titles though. I always copy to a new sheet for further analysis and graphing.
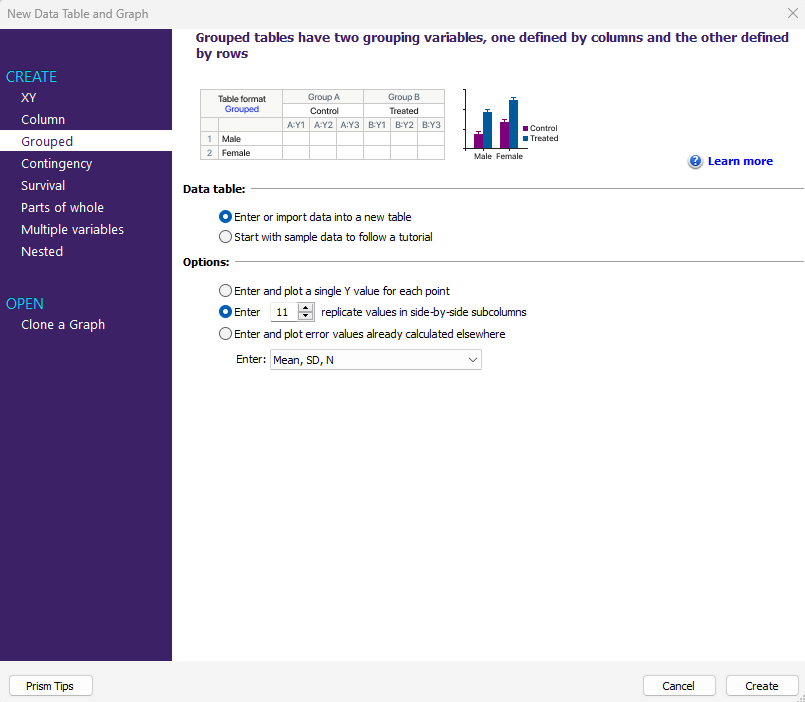
Create new sheet
Create a new grouped sheet with the appropriate number of sub-columns in each group (in my case 11).
Copy your data over to the new one and edit row and column names
You’re done!